Data Side of the Moon
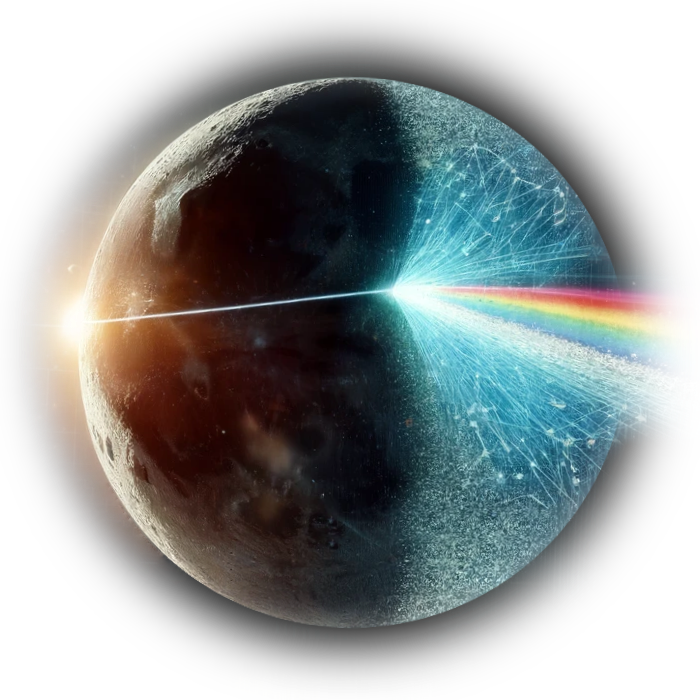
Can a neural network learn to "hear" music — without ever being told what genre it is?
Genre labels are a human invention. They’re useful, but they’re also reductive — Pink Floyd doesn’t fit neatly into “rock,” and neither does most interesting music. Supervised classification is bounded by the labels we give it.
This project takes a different approach: train a convolutional autoencoder on raw mel-spectrograms with no labels at all, then see what structure the model discovers on its own. The autoencoder — named Echoes — compresses 15-second audio segments into 128-dimensional latent vectors, learning a representation of “what music sounds like” purely from reconstruction.
When we project Pink Floyd’s entire discography into this learned space and cluster it, something interesting emerges: the clusters track the band’s stylistic evolution across decades — without the model knowing anything about albums, years, or genres.
How It Works
flowchart LR
    A["🎵 Audio"] --> B["Mel-Spectrogram\n(256 × 646)"]
    B --> C["Encoder\n4× Conv2d"]
    C --> D["Latent Vector\n128-dim"]
    D --> E["Decoder\n4× ConvTranspose2d"]
    E --> F["Reconstructed\nSpectrogram"]
    D --> G["K-Means\nClustering"]
    G --> H["PCA / t-SNE\nVisualization"]

    style A fill:#1a1a2e,stroke:#e94560,color:#eee
    style D fill:#1a1a2e,stroke:#e94560,color:#eee
    style H fill:#1a1a2e,stroke:#e94560,color:#eee
1. Preprocessing — Raw audio is converted to normalized log-mel spectrograms (256 mel bins, 2048-point FFT, hop length 512). Each song is split into 15-second segments.
2. Encoding — Echoes compresses each spectrogram into a 128-dimensional latent vector. A per-song embedding is computed by volume-weighted (RMS) averaging across all segments — giving more weight to louder, more musically active passages.
3. Analysis — K-means clustering, PCA, and t-SNE applied to the latent vectors reveal natural groupings in the music.
The Model
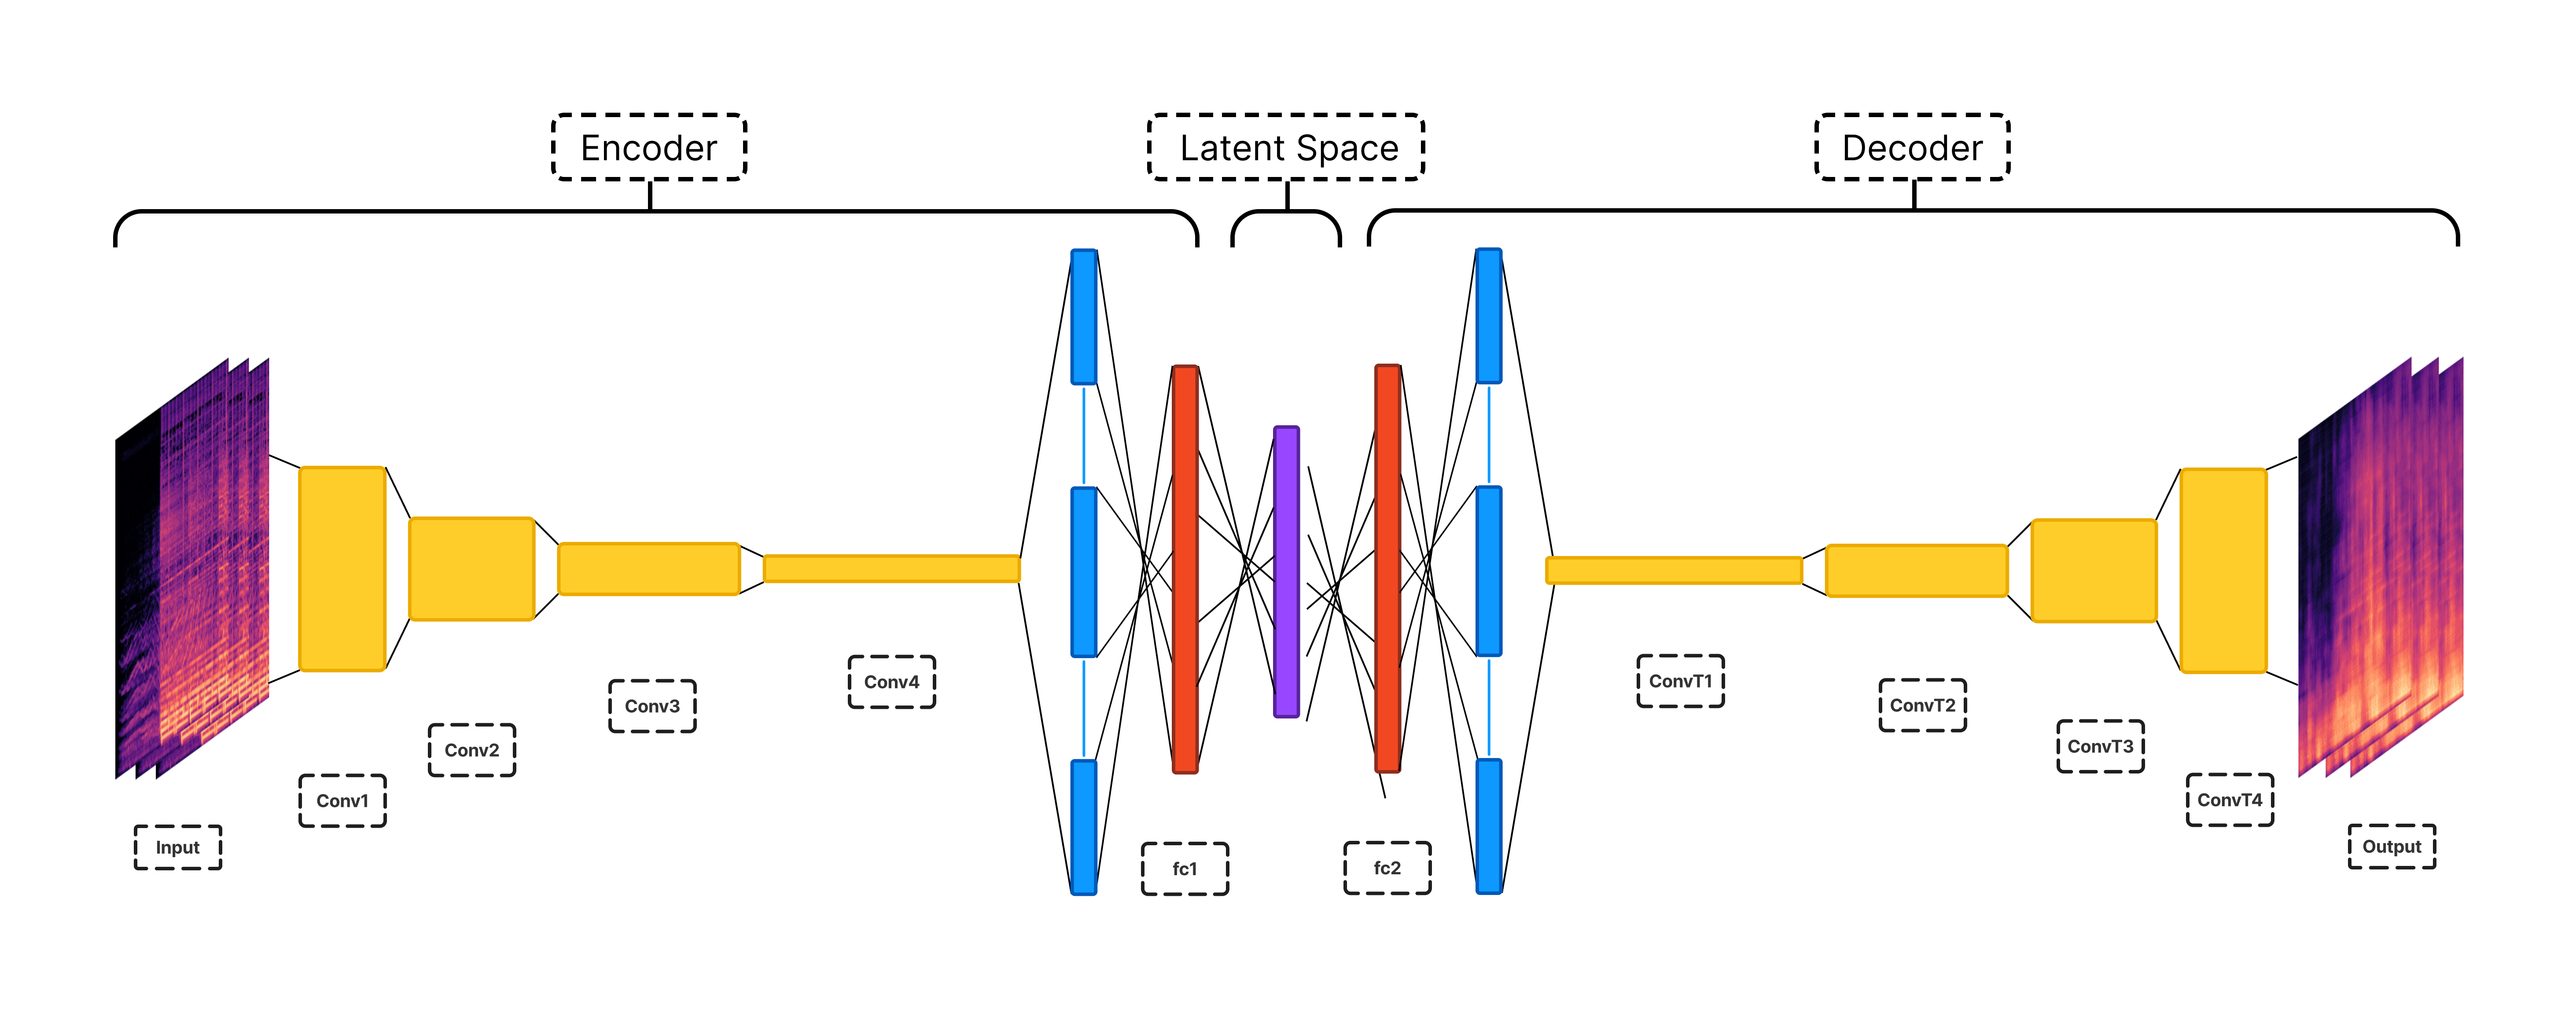
Echoes is a symmetric convolutional autoencoder:
| Layers | Details |
|---|
| Encoder | 4 Conv2d layers | 1 → 16 → 32 → 64 → 128 channels, stride 2, BatchNorm + LeakyReLU |
| Bottleneck | 2 Linear layers | 83,968 → 256 → 128 dimensions |
| Decoder | 2 Linear + 4 ConvTranspose2d | Mirrors the encoder |
Trained unsupervised with MSE reconstruction loss on the GTZAN dataset (~1,000 tracks, 10 genres). The model never sees genre labels — it simply learns to reconstruct spectrograms, and the latent space organizes itself.
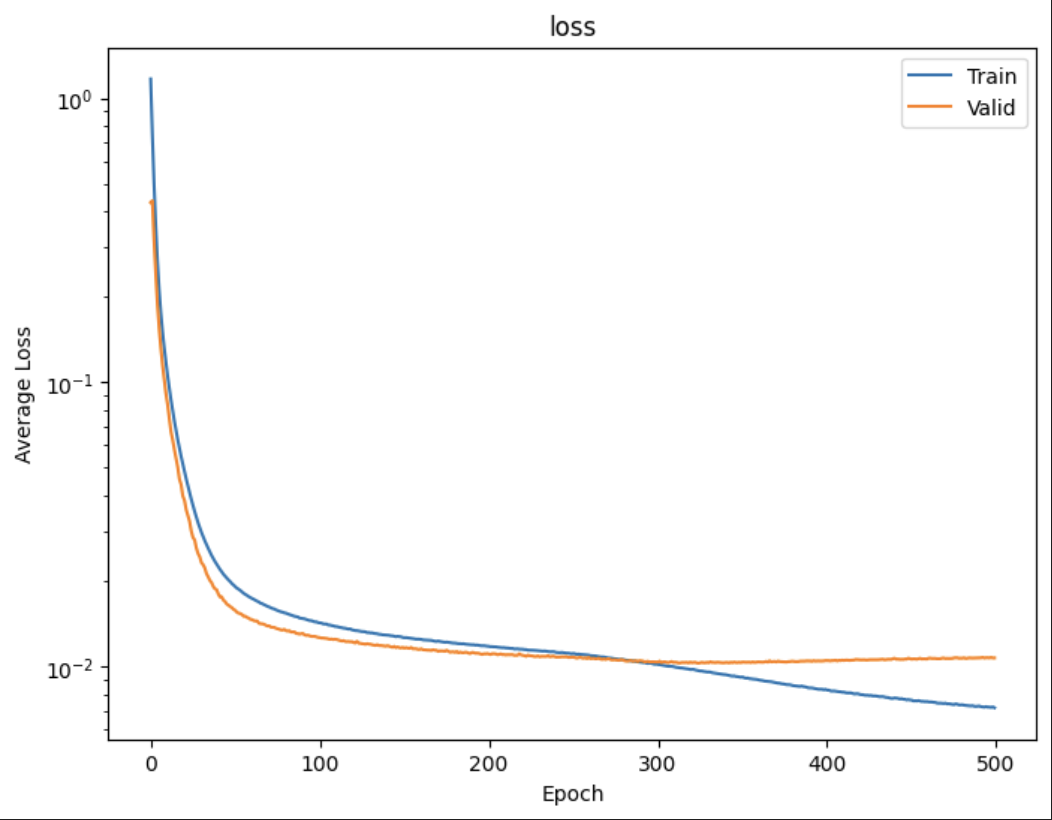
Training and validation loss over 500 epochs. Smooth convergence, minimal overfitting.
Results
The latent space separates genres — without labels
To validate that Echoes learns musically meaningful features, we visualize the latent vectors of unseen GTZAN test samples via t-SNE. Metal, pop, and classical form distinct clusters — despite the model receiving zero genre supervision during training.
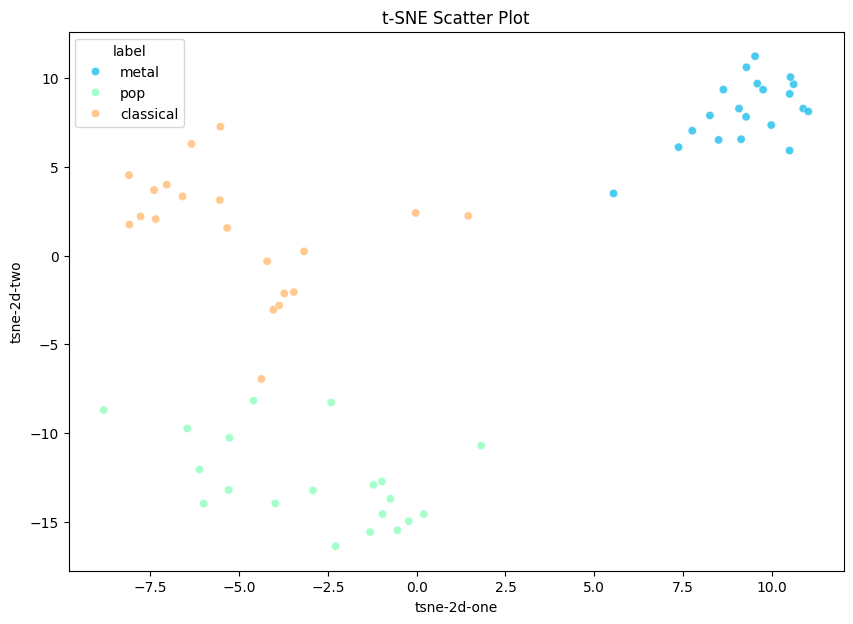
t-SNE projection of latent vectors from held-out GTZAN tracks. Clear genre separation emerges unsupervised.
Pink Floyd’s stylistic evolution, as seen by the model
Applied to Pink Floyd’s complete studio discography (1967–2014, 13 albums, 160+ tracks), the model’s clusters map onto the band’s well-known stylistic periods:
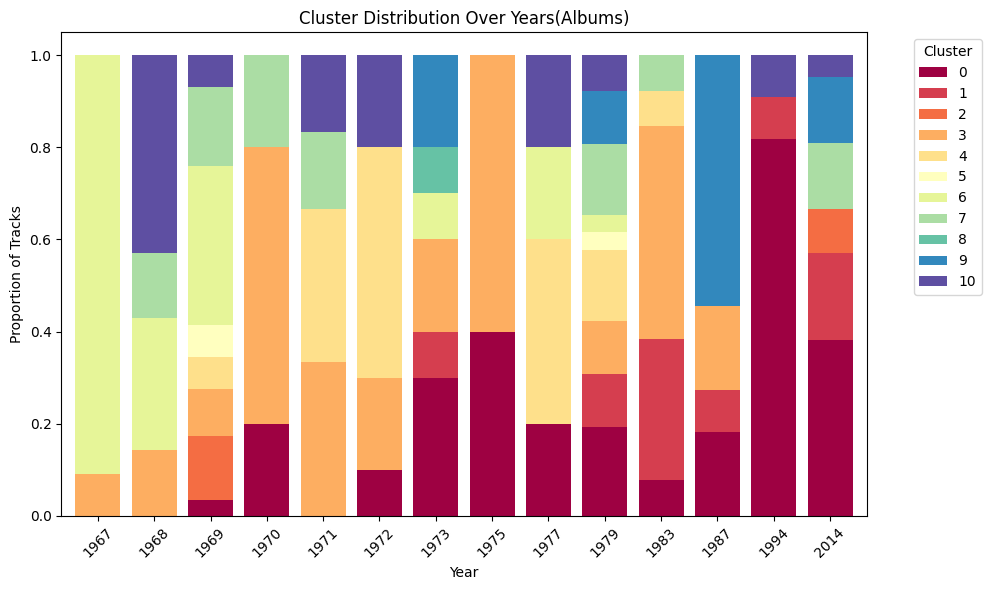
Proportion of tracks per cluster across albums. Each color is a cluster discovered by the model.
The early psychedelic era (1967–1969) is dominated by one set of clusters; the progressive period around The Dark Side of the Moon (1973) and Wish You Were Here (1975) introduces new ones; and the later, more produced albums (1983–2014) shift again. The model rediscovers what music historians describe — from the signal alone.
Installation
git clone https://github.com/Audiofool934/Data-Side-of-the-Moon.git
cd Data-Side-of-the-Moon
pip install -e .
For development:
pip install -e ".[dev]"
pytest
Usage
CLI
echoes preprocess --input data/audio/ --output data/spec/
echoes encode --input data/audio/Pink\ Floyd/ \
--model models/Echoes_128/encoder.pth \
--output database/AE.h5
echoes cluster --input database/AE.h5 --n-clusters 11 --output database/clustered.h5
Python
from echoes.model import Encoder, Decoder, load_encoder
from echoes.pipeline.encode import encode_song
vector = encode_song("song.mp3", model_path="models/Echoes_128/encoder.pth")
Notebooks
| Notebook | Description |
|---|
notebooks/01_training.ipynb | Model training, loss curves, reconstruction examples |
notebooks/02_visualization.ipynb | Latent space visualization (t-SNE, PCA) |
notebooks/03_analysis.ipynb | Clustering experiments and Pink Floyd analysis |
Project Structure
echoes/                     Python package
├── config.py               Frozen dataclass configs (spectrogram, model, training)
├── model/                  Encoder, Decoder, train/test loops
├── audio/                  Spectrogram, segmentation, MFCC baseline
├── pipeline/               Preprocessing, encoding, feature extraction
├── analysis/               K-means clustering, cluster ranking
├── visualization/          Plotting (PCA, t-SNE, cluster distributions)
└── utils/                  File I/O, metadata parsing

notebooks/                  Jupyter notebooks
tests/                      Unit tests
media/                      Architecture diagrams, result figures
report.pdf                  Full academic report
Tech Stack
PyTorch, librosa, scikit-learn, h5py, pandas, matplotlib, seaborn, click
License
This project is for educational and research purposes.